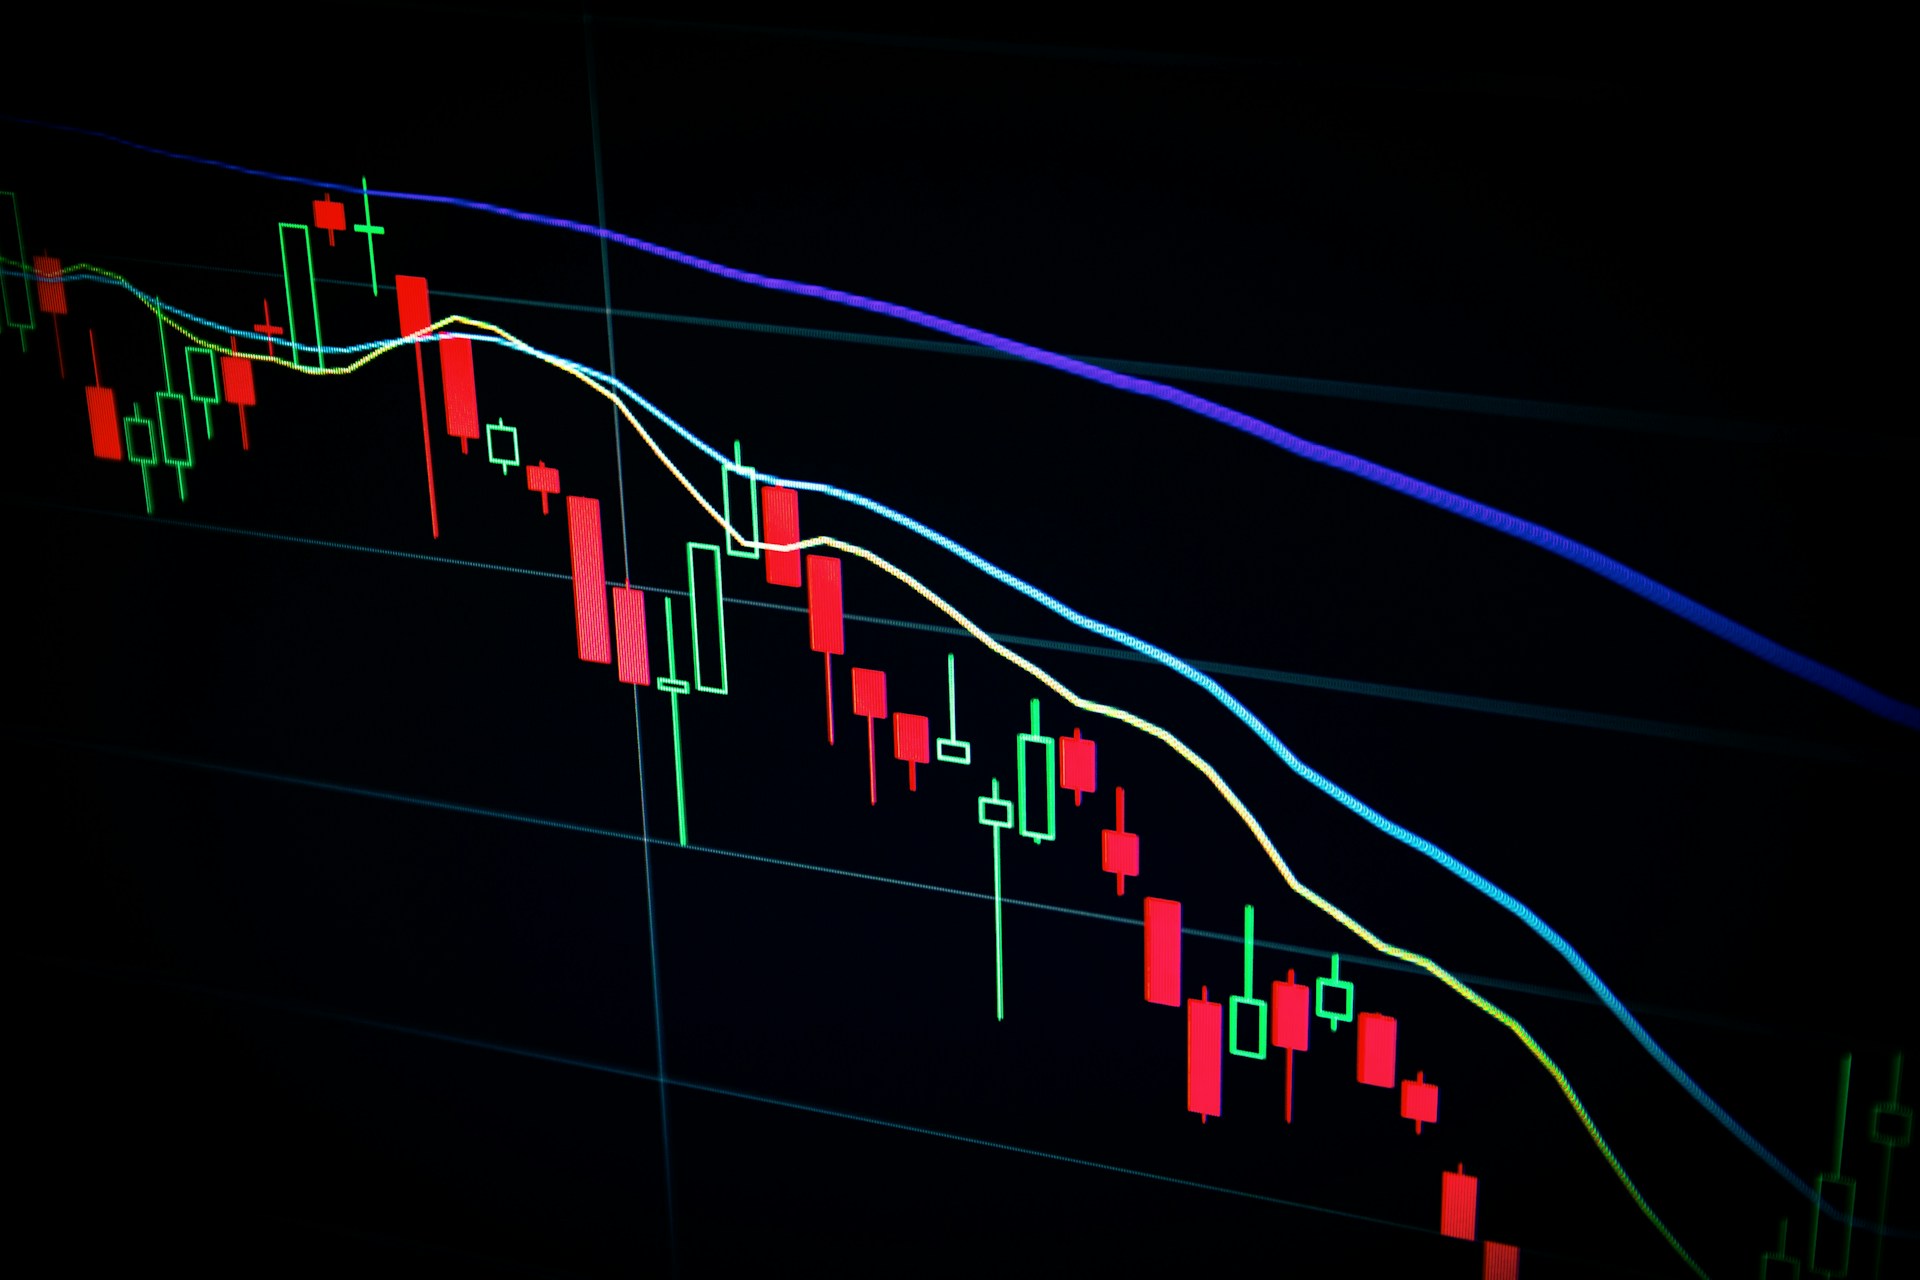
Candlestick patterns are a cornerstone of technical analysis and a powerful tool for traders seeking to understand price action and predict future market behavior. Developed in 18th-century Japan and popularized in Western trading by Steve Nison, candlestick charts visually represent the battle between buyers and sellers in any financial market.
For traders across forex, crypto, stocks, and commodities, memorizing key candlestick patterns is essential. These patterns help identify potential reversals, continuations, and key support/resistance levels—all critical for timing entries and exits effectively.
In this guide, we'll explore the most important candlestick patterns every trader should know, how to read them, and tips for using them in real trading conditions.
Understanding Candlestick Basics
Before diving into specific patterns, it's essential to understand how a candlestick is constructed:
- Open: The price at which the asset starts during a time period
- Close: The price at the end of that time period
- High and Low: The highest and lowest prices reached
- Body: The distance between the open and close (colored green for bullish, red for bearish)
- Wicks (or Shadows): Thin lines above and below the body showing high and low prices
Candlesticks reflect market sentiment visually, revealing who’s in control—buyers or sellers—within each time frame.
Why Candlestick Patterns Matter
Unlike lagging indicators, candlestick patterns provide real-time insights into market psychology. They reflect shifts in momentum, indecision, and reversal signals far earlier than many other tools. While no pattern guarantees outcomes, combined with context and volume, they greatly improve decision-making.
Reversal Candlestick Patterns
These patterns often signal the end of a current trend and the potential beginning of a new one.
1. Hammer
Appears in a downtrend
Small real body near the top
Long lower wick at least twice the size of the body
Bullish signal
2. Hanging Man
Appears in an uptrend
Same shape as hammer
Bearish signal
3. Inverted Hammer
Appears in a downtrend
Small body with a long upper wick and little or no lower wick
Bullish reversal indicator
4. Shooting Star
Appears in an uptrend
Small body with a long upper wick and little to no lower wick
Bearish reversal indicator
5. Bullish Engulfing
Small bearish candle followed by a larger bullish candle that completely engulfs it
Found at the bottom of a downtrend
6. Bearish Engulfing
Small bullish candle followed by a larger bearish candle
Found at the top of an uptrend
7. Morning Star
Three-candle pattern: bearish, small-bodied (gap down), and strong bullish candle
Bullish reversal signal
8. Evening Star
Opposite of Morning Star; appears after an uptrend
Bearish reversal pattern
9. Piercing Line
Two-candle bullish pattern
First: long bearish candle; Second: bullish candle that opens lower but closes above midpoint of first
10. Dark Cloud Cover
Bearish counterpart of Piercing Line
First: long bullish candle; Second: bearish candle opens above and closes below midpoint
11. Tweezer Bottom
Two candles with similar lows
Found at the bottom of a downtrend
12. Tweezer Top
Two candles with similar highs
Appears after an uptrend
13. Three White Soldiers
Three consecutive long bullish candles with higher closes
Strong bullish reversal pattern
14. Three Black Crows
Three consecutive long bearish candles
Strong bearish reversal pattern
15. Dragonfly Doji
Open, close, and high nearly the same with long lower wick
Bullish reversal if found at bottom
16. Gravestone Doji
Open, close, and low nearly the same with long upper wick
Bearish reversal if found at top
17. Doji Star
Appears after a strong trend
Small body or no body, indicating indecision
18. Abandoned Baby
Rare but powerful three-candle reversal pattern
Middle candle gaps away from the previous and following candles (can be bullish or bearish)
Continuation Candlestick Patterns
These patterns suggest the current trend will likely resume after a pause.
19. Rising Three Methods
Long bullish candle, followed by several small bearish candles, then another bullish candle
20. Falling Three Methods
Long bearish candle, several small bullish candles, then another bearish candle
21. Bullish Harami
Large bearish candle followed by a small bullish candle within the previous candle’s body
22. Bearish Harami
Large bullish candle followed by a small bearish candle within its body
23. Bullish Mat Hold
Similar to Rising Three Methods but slightly more complex; indicates continuation of an uptrend
24. Bearish Mat Hold
Continuation of a downtrend with brief pause and resumed selling
25. Upside Tasuki Gap
Two bullish candles with a gap, followed by a bearish candle that partially fills the gap but not fully
26. Downside Tasuki Gap
Two bearish candles with a gap, then a bullish candle partially filling the gap
Indecision Candlestick Patterns
These patterns represent market uncertainty and can precede breakouts or reversals.
27. Spinning Top
Small body with long upper and lower shadows
Indicates indecision
28. Long-Legged Doji
Doji with very long upper and lower shadows
Signifies high indecision and potential reversal
29. Inside Bar
Entire candle is within the range of the previous candle
Consolidation before breakout
30. Outside Bar
Candle that engulfs the previous candle entirely (can be bullish or bearish)
Tips for Using Candlestick Patterns
Combine with context: Look at support/resistance, trend direction, and volume.
- Use confirmation: Avoid trading solely based on one candle. Wait for confirmation.
- Practice in demo: Build pattern recognition and learn how different assets react.
- Avoid lower timeframes initially: Start with daily or 4H charts for clearer patterns.
Common Pitfalls to Avoid
- Misinterpreting patterns out of context
Overtrading based on every signal
- Ignoring trend direction or support/resistance
- Neglecting stop-loss placement
Final Thoughts
Candlestick patterns offer traders a visual understanding of price dynamics and market psychology. While memorizing patterns is helpful, true mastery lies in using them within broader market context. Combine them with risk management, trend analysis, and confirmation signals to increase your edge in the markets.
With consistent practice and disciplined trading, candlestick patterns can become one of your most valuable tools for reading the market and making informed decisions.

